04
Writing, Debugging, and Testing Functions
This chapter is about writing functions to reuse code, debugging logic errors during development, logging exceptions during runtime, unit testing your code to remove bugs, and ensuring stability and reliability.
This chapter covers the following topics:
- Writing functions
- Debugging during development
- Logging during runtime
- Unit testing
- Throwing and catching exceptions in functions
Writing functions
A fundamental principle of programming is Don't Repeat Yourself (DRY).
While programming, if you find yourself writing the same statements over and over again, then turn those statements into a function. Functions are like tiny programs that complete one small task. For example, you might write a function to calculate sales tax and then reuse that function in many places in a financial application.
Like programs, functions usually have inputs and outputs. They are sometimes described as black boxes, where you feed some raw materials in one end, and a manufactured item emerges at the other. Once created, you don't need to think about how they work.
Times table example
Let's say that you want to help your child learn their times tables, so you want to make it easy to generate a times table for a number, such as the 12 times table:
1 x 12 = 12
2 x 12 = 24
...
12 x 12 = 144
You previously learned about the for statement earlier in this book, so you know that it can be used to generate repeated lines of output when there is a regular pattern, such as the 12 times table, as shown in the following code:
for (int row = 1; row <= 12; row++)
{
  Console.WriteLine($"{row} x 12 = {row * 12}");
}
However, instead of outputting the 12 times table, we want to make this more flexible, so it could output the times table for any number. We can do this by creating a function.
Writing a times table function
Let's explore functions by creating one to output any times table for numbers 0 to 255 multiplied by 1 to 12:
- Use your preferred coding tool to create a new console app, as defined in the following list:
- Project template: Console Application /
console - Workspace/solution file and folder:
Chapter04 - Project file and folder:
WritingFunctions
- Project template: Console Application /
- Statically import
System.Console. - In
Program.cs, write statements to define a function namedTimesTable, as shown in the following code:static void TimesTable(byte number) { WriteLine($"This is the {number} times table:"); for (int row = 1; row <= 12; row++) { WriteLine($"{row} x {number} = {row * number}"); } WriteLine(); }In the preceding code, note the following:
TimesTablemust have abytevalue passed to it as a parameter namednumber.TimesTableis astaticmethod because it will be called by thestaticmethodMain.TimesTabledoes not return a value to the caller, so it is declared with thevoidkeyword before its name.TimesTableuses aforstatement to output the times table for thenumberpassed to it.
- After the statement that statically imports the
Consoleclass and before theTimesTablefunction, call the function and pass in abytevalue for thenumberparameter, for example,6, as shown highlighted in the following code:using static System.Console; TimesTable(6);Good Practice: If a function has one or more parameters where just passing the values may not provide enough meaning, then you can optionally specify the name of the parameter as well as its value, as shown in the following code:
TimesTable(number: 6). - Run the code and then view the result, as shown in the following output:
This is the 6 times table: 1 x 6 = 6 2 x 6 = 12 3 x 6 = 18 4 x 6 = 24 5 x 6 = 30 6 x 6 = 36 7 x 6 = 42 8 x 6 = 48 9 x 6 = 54 10 x 6 = 60 11 x 6 = 66 12 x 6 = 72 - Change the number passed into the
TimesTablefunction to otherbytevalues between0and255and confirm that the output times tables are correct. - Note that if you try to pass a non-
bytenumber, for example, anintordoubleorstring, an error is returned, as shown in the following output:Error: (1,12): error CS1503: Argument 1: cannot convert from 'int' to 'byte'
Writing a function that returns a value
The previous function performed actions (looping and writing to the console), but it did not return a value. Let's say that you need to calculate sales or value-added tax (VAT). In Europe, VAT rates can range from 8% in Switzerland to 27% in Hungary. In the United States, state sales taxes can range from 0% in Oregon to 8.25% in California.
Tax rates change all the time, and they vary based on many factors. You do not need to contact me to tell me that the tax rate in Virginia is 6%. Thank you.
Let's implement a function to calculate taxes in various regions around the world:
- Add a function named
CalculateTax, as shown in the following code:static decimal CalculateTax( decimal amount, string twoLetterRegionCode) { decimal rate = 0.0M; switch (twoLetterRegionCode) { case "CH": // Switzerland rate = 0.08M; break; case "DK": // Denmark case "NO": // Norway rate = 0.25M; break; case "GB": // United Kingdom case "FR": // France rate = 0.2M; break; case "HU": // Hungary rate = 0.27M; break; case "OR": // Oregon case "AK": // Alaska case "MT": // Montana rate = 0.0M; break; case "ND": // North Dakota case "WI": // Wisconsin case "ME": // Maine case "VA": // Virginia rate = 0.05M; break; case "CA": // California rate = 0.0825M; break; default: // most US states rate = 0.06M; break; } return amount * rate; }In the preceding code, note the following:
CalculateTaxhas two inputs: a parameter namedamountthat will be the amount of money spent, and a parameter namedtwoLetterRegionCodethat will be the region the amount is spent in.CalculateTaxwill perform a calculation using aswitchstatement and then return the sales tax or VAT owed on the amount as adecimalvalue; so, before the name of the function, we have declared the data type of the return value to bedecimal.
- Comment out the
TimesTablemethod call and call theCalculateTaxmethod, passing values for the amount such as149and a valid region code such asFR, as shown in the following code:// TimesTable(6); decimal taxToPay = CalculateTax(amount: 149, twoLetterRegionCode: "FR"); WriteLine($"You must pay {taxToPay} in tax."); - Run the code and view the result, as shown in the following output:
You must pay 29.8 in tax.
We could format the taxToPay output as currency by using {taxToPay:C} but it will use your local culture to decide how to format the currency symbol and decimals. For example, for me in the UK, I would see £29.80.
Can you think of any problems with the CalculateTax function as written? What would happen if the user enters a code such as fr or UK? How could you rewrite the function to improve it? Would using a switch expression instead of a switch statement be clearer?
Converting numbers from cardinal to ordinal
Numbers that are used to count are called cardinal numbers, for example, 1, 2, and 3, whereas numbers used to order are ordinal numbers, for example, 1st, 2nd, and 3rd. Let's create a function to convert cardinals to ordinals:
- Write a function named
CardinalToOrdinalthat converts a cardinalintvalue into an ordinalstringvalue; for example, it converts 1 into 1st, 2 into 2nd, and so on, as shown in the following code:static string CardinalToOrdinal(int number) { switch (number) { case 11: // special cases for 11th to 13th case 12: case 13: return $"{number}th"; default: int lastDigit = number % 10; string suffix = lastDigit switch { 1 => "st", 2 => "nd", 3 => "rd", _ => "th" }; return $"{number}{suffix}"; } }From the preceding code, note the following:
CardinalToOrdinalhas one input: a parameter of theinttype namednumber, and one output: a return value of thestringtype.- A
switchstatement is used to handle the special cases of 11, 12, and 13. - A
switchexpression then handles all other cases: if the last digit is 1, then usestas the suffix; if the last digit is 2, then usendas the suffix; if the last digit is 3, then userdas the suffix; and if the last digit is anything else, then usethas the suffix.
- Write a function named
RunCardinalToOrdinalthat uses aforstatement to loop from 1 to 40, calling theCardinalToOrdinalfunction for each number and writing the returnedstringto the console, separated by a space character, as shown in the following code:static void RunCardinalToOrdinal() { for (int number = 1; number <= 40; number++) { Write($"{CardinalToOrdinal(number)} "); } WriteLine(); } - Comment out the
CalculateTaxstatements, and call theRunCardinalToOrdinalmethod, as shown in the following code:// TimesTable(6); // decimal taxToPay = CalculateTax(amount: 149, twoLetterRegionCode: "FR"); // WriteLine($"You must pay {taxToPay} in tax."); RunCardinalToOrdinal(); - Run the code and view the results, as shown in the following output:
1st 2nd 3rd 4th 5th 6th 7th 8th 9th 10th 11th 12th 13th 14th 15th 16th 17th 18th 19th 20th 21st 22nd 23rd 24th 25th 26th 27th 28th 29th 30th 31st 32nd 33rd 34th 35th 36th 37th 38th 39th 40th
Calculating factorials with recursion
The factorial of 5 is 120, because factorials are calculated by multiplying the starting number by one less than itself, and then by one less again, and so on, until the number is reduced to 1. An example can be seen here: 5 x 4 x 3 x 2 x 1 = 120.
Factorials are written like this: 5!, where the exclamation mark is read as bang, so 5! = 120, that is, five bang equals one hundred and twenty. Bang is a good name for factorials because they increase in size very rapidly, just like an explosion.
We will write a function named Factorial; this will calculate the factorial for an int passed to it as a parameter. We will use a clever technique called recursion, which means a function that calls itself within its implementation, either directly or indirectly:
- Add a function named
Factorial, and a function to call it, as shown in the following code:static int Factorial(int number) { if (number < 1) { return 0; } else if (number == 1) { return 1; } else { return number * Factorial(number - 1); } }As before, there are several noteworthy elements of the preceding code, including the following:
- If the input parameter
numberis zero or negative,Factorialreturns0. - If the input parameter
numberis1,Factorialreturns1, and therefore stops calling itself. - If the input parameter
numberis larger than one, which it will be in all other cases,Factorialmultiplies the number by the result of calling itself and passing one less thannumber. This makes the function recursive.
More Information: Recursion is clever, but it can lead to problems, such as a stack overflow due to too many function calls because memory is used to store data on every function call, and it eventually uses too much. Iteration is a more practical, if less succinct, solution in languages such as C#. You can read more about this at the following link: https://en.wikipedia.org/wiki/Recursion_(computer_science)#Recursion_versus_iteration.
- If the input parameter
- Add a function named
RunFactorialthat uses aforstatement to output the factorials of numbers from 1 to 14, calls theFactorialfunction inside its loop, and then outputs the result, formatted using the codeN0, which means number format uses thousand separators with zero decimal places, as shown in the following code:static void RunFactorial() { for (int i = 1; i < 15; i++) { WriteLine($"{i}! = {Factorial(i):N0}"); } } - Comment out the
RunCardinalToOrdinalmethod call and call theRunFactorialmethod. - Run the code and view the results, as shown in the following output:
1! = 1
2! = 2
3! = 6
4! = 24
5! = 120
6! = 720
7! = 5,040
8! = 40,320
9! = 362,880
10! = 3,628,800
11! = 39,916,800
12! = 479,001,600
13! = 1,932,053,504
14! = 1,278,945,280
It is not immediately obvious in the previous output, but factorials of 13 and higher overflow the int type because they are so big. 12! is 479,001,600, which is about half a billion. The maximum positive value that can be stored in an int variable is about two billion. 13! is 6,227,020,800, which is about six billion and when stored in a 32-bit integer it overflows silently without showing any problems.
Do you remember what we can do to be notified of a numeric overflow?
What should you do to get notified when an overflow happens? Of course, we could solve the problem for 13! and 14! by using a long (64-bit integer) instead of an int (32-bit integer), but we will quickly hit the overflow limit again.
The point of this section is to understand that numbers can overflow and how to show that rather than ignore it, not specifically how to calculate factorials higher than 12!.
- Modify the
Factorialfunction to check for overflows, as shown highlighted in the following code:checked // for overflow { return number * Factorial(number - 1); } - Modify the
RunFactorialfunction to handle overflow exceptions when calling theFactorialfunction, as shown highlighted in the following code:try { WriteLine($"{i}! = {Factorial(i):N0}"); } catch (System.OverflowException) { WriteLine($"{i}! is too big for a 32-bit integer."); } - Run the code and view the results, as shown in the following output:
1! = 1
2! = 2
3! = 6
4! = 24
5! = 120
6! = 720
7! = 5,040
8! = 40,320
9! = 362,880
10! = 3,628,800
11! = 39,916,800
12! = 479,001,600
13! is too big for a 32-bit integer.
14! is too big for a 32-bit integer.
Documenting functions with XML comments
By default, when calling a function such as CardinalToOrdinal, code editors will show a tooltip with basic information, as shown in Figure 4.1:
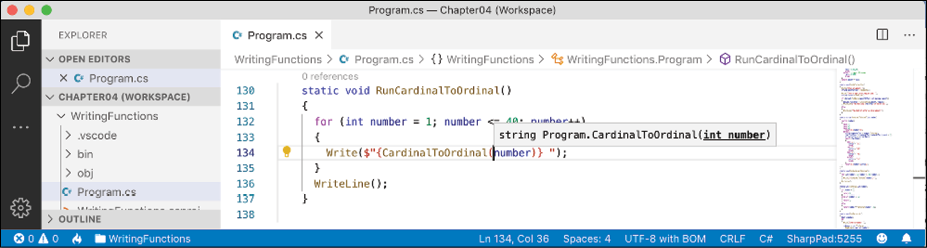
Figure 4.1: A tooltip showing the default simple method signature
Let's improve the tooltip by adding extra information:
- If you are using Visual Studio Code with the C# extension, you should navigate to View | Command Palette | Preferences: Open Settings (UI), and then search for
formatOnTypeand make sure that is enabled. C# XML documentation comments are a built-in feature of Visual Studio 2022. - On the line above the
CardinalToOrdinalfunction, type three forward slashes///, and note that they are expanded into an XML comment that recognizes that the function has a single parameter namednumber. - Enter suitable information for the XML documentation comment for a summary and to describe the input parameter and the return value for the
CardinalToOrdinalfunction, as shown in the following code:/// <summary> /// Pass a 32-bit integer and it will be converted into its ordinal equivalent. /// </summary> /// <param name="number">Number is a cardinal value e.g. 1, 2, 3, and so on.</param> /// <returns>Number as an ordinal value e.g. 1st, 2nd, 3rd, and so on.</returns> - Now, when calling the function, you will see more details, as shown in Figure 4.2:
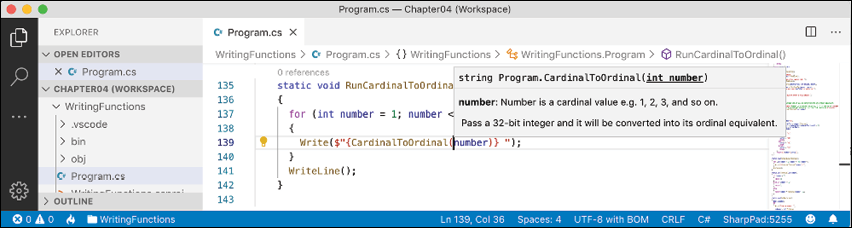
Figure 4.2: A tooltip showing the more detailed method signature
At the time of writing the sixth edition, C# XML documentation comments do not work in .NET Interactive notebooks.
Good Practice: Add XML documentation comments to all your functions.
Using lambdas in function implementations
F# is Microsoft's strongly typed functional-first programming language that, like C#, compiles to IL to be executed by .NET. Functional languages evolved from lambda calculus; a computational system based only on functions. The code looks more like mathematical functions than steps in a recipe.
Some of the important attributes of functional languages are defined in the following list:
- Modularity: The same benefit of defining functions in C# applies to functional languages. Break up a large complex code base into smaller pieces.
- Immutability: Variables in the C# sense do not exist. Any data value inside a function cannot change. Instead, a new data value can be created from an existing one. This reduces bugs.
- Maintainability: Code is cleaner and clearer (for mathematically inclined programmers!).
Since C# 6, Microsoft has worked to add features to the language to support a more functional approach. For example, adding tuples and pattern matching in C# 7, non-null reference types in C# 8, and improving pattern matching and adding records, that is, immutable objects in C# 9.
In C# 6, Microsoft added support for expression-bodied function members. We will look at an example of this now.
The Fibonacci sequence of numbers always starts with 0 and 1. Then the rest of the sequence is generated using the rule of adding together the previous two numbers, as shown in the following sequence of numbers:
0 1 1 2 3 5 8 13 21 34 55 ...
The next term in the sequence would be 34 + 55, which is 89.
We will use the Fibonacci sequence to illustrate the difference between an imperative and declarative function implementation:
- Add a function named
FibImperativethat will be written in an imperative style, as shown in the following code:static int FibImperative(int term) { if (term == 1) { return 0; } else if (term == 2) { return 1; } else { return FibImperative(term - 1) + FibImperative(term - 2); } } - Add a function named
RunFibImperativethat callsFibImperativeinside aforstatement that loops from 1 to 30, as shown in the following code:static void RunFibImperative() { for (int i = 1; i <= 30; i++) { WriteLine("The {0} term of the Fibonacci sequence is {1:N0}.", arg0: CardinalToOrdinal(i), arg1: FibImperative(term: i)); } } - Comment out the other method calls and call the
RunFibImperativemethod. - Run the code and view the results, as shown in the following output:
The 1st term of the Fibonacci sequence is 0. The 2nd term of the Fibonacci sequence is 1. The 3rd term of the Fibonacci sequence is 1. The 4th term of the Fibonacci sequence is 2. The 5th term of the Fibonacci sequence is 3. The 6th term of the Fibonacci sequence is 5. The 7th term of the Fibonacci sequence is 8. The 8th term of the Fibonacci sequence is 13. The 9th term of the Fibonacci sequence is 21. The 10th term of the Fibonacci sequence is 34. The 11th term of the Fibonacci sequence is 55. The 12th term of the Fibonacci sequence is 89. The 13th term of the Fibonacci sequence is 144. The 14th term of the Fibonacci sequence is 233. The 15th term of the Fibonacci sequence is 377. The 16th term of the Fibonacci sequence is 610. The 17th term of the Fibonacci sequence is 987. The 18th term of the Fibonacci sequence is 1,597. The 19th term of the Fibonacci sequence is 2,584. The 20th term of the Fibonacci sequence is 4,181. The 21st term of the Fibonacci sequence is 6,765. The 22nd term of the Fibonacci sequence is 10,946. The 23rd term of the Fibonacci sequence is 17,711. The 24th term of the Fibonacci sequence is 28,657. The 25th term of the Fibonacci sequence is 46,368. The 26th term of the Fibonacci sequence is 75,025. The 27th term of the Fibonacci sequence is 121,393. The 28th term of the Fibonacci sequence is 196,418. The 29th term of the Fibonacci sequence is 317,811. The 30th term of the Fibonacci sequence is 514,229. - Add a function named
FibFunctionalwritten in a declarative style, as shown in the following code:static int FibFunctional(int term) => term switch { 1 => 0, 2 => 1, _ => FibFunctional(term - 1) + FibFunctional(term - 2) }; - Add a function to call it inside a
forstatement that loops from 1 to 30, as shown in the following code:static void RunFibFunctional() { for (int i = 1; i <= 30; i++) { WriteLine("The {0} term of the Fibonacci sequence is {1:N0}.", arg0: CardinalToOrdinal(i), arg1: FibFunctional(term: i)); } } - Comment out the
RunFibImperativemethod call, and call theRunFibFunctionalmethod. - Run the code and view the results (which will be the same as before).
Debugging during development
In this section, you will learn how to debug problems at development time. You must use a code editor that has debugging tools such as Visual Studio or Visual Studio Code. At the time of writing, you cannot use .NET Interactive Notebooks to debug code, but this is expected to be added in the future.
More Information: Some people find it tricky setting up the OmniSharp debugger for Visual Studio Code. I have included instructions for the most common issues, but if you still have trouble, try reading the information at the following link: https://github.com/OmniSharp/omnisharp-vscode/blob/master/debugger.md
Creating code with a deliberate bug
Let's explore debugging by creating a console app with a deliberate bug that we will then use the debugger tools in your code editor to track down and fix:
- Use your preferred coding tool to add a new Console Application to the
Chapter04workspace/solution namedDebugging. - In Visual Studio Code, select
Debuggingas the active OmniSharp project. When you see the pop-up warning message saying that required assets are missing, click Yes to add them. - In Visual Studio, set the startup project for the solution to the current selection.
- In
Program.cs, add a function with a deliberate bug, as shown in the following code:static double Add(double a, double b) { return a * b; // deliberate bug! } - Below the
Addfunction, write statements to declare and set some variables and then add them together using the buggy function, as shown in the following code:double a = 4.5; double b = 2.5; double answer = Add(a, b); WriteLine($"{a} + {b} = {answer}"); WriteLine("Press ENTER to end the app."); ReadLine(); // wait for user to press ENTER - Run the console application and view the result, as shown in the following partial output:
4.5 + 2.5 = 11.25
But wait, there's a bug! 4.5 added to 2.5 should be 7, not 11.25!
We will use the debugging tools to hunt for and squash the bug.
Setting a breakpoint and start debugging
Breakpoints allow us to mark a line of code that we want to pause at to inspect the program state and find bugs.
Using Visual Studio 2022
Let's set a breakpoint and then start debugging using Visual Studio 2022:
- Click in the statement that declares the variable named
a. - Navigate to Debug | Toggle Breakpoint or press F9. A red circle will then appear in the margin bar on the left-hand side and the statement will be highlighted in red to indicate that a breakpoint has been set, as shown in Figure 4.3:
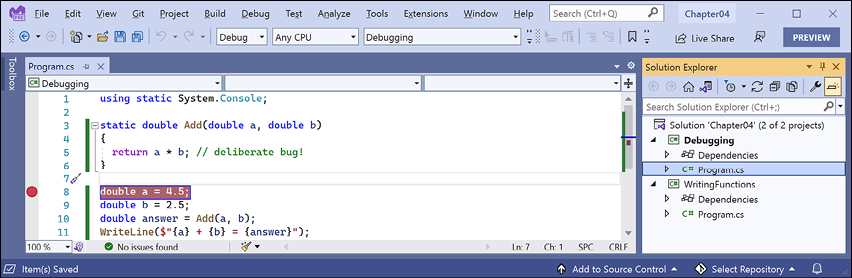
Figure 4.3: Toggling breakpoints using Visual Studio 2022
Breakpoints can be toggled off with the same action. You can also left-click in the margin to toggle a breakpoint on and off, or right-click a breakpoint to see more options, such as delete, disable, or edit conditions or actions for an existing breakpoint.
- Navigate to Debug | Start Debugging or press F5. Visual Studio starts the console application and then pauses when it hits the breakpoint. This is known as break mode. Extra windows titled Locals (showing current values of local variables), Watch 1 (showing any watch expressions you have defined), Call Stack, Exception Settings, and Immediate Window appear. The Debugging toolbar appears. The line that will be executed next is highlighted in yellow, and a yellow arrow points at the line from the margin bar, as shown in Figure 4.4:
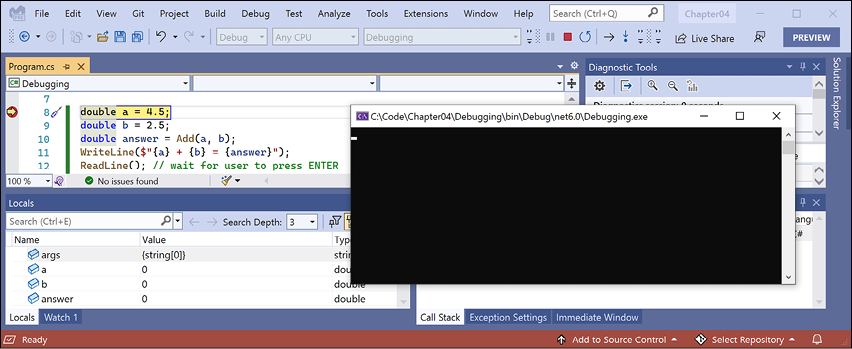
Figure 4.4: Break mode in Visual Studio 2022
If you do not want to see how to use Visual Studio Code to start debugging then you can skip the next section and continue to the section titled Navigating with the debugging toolbar.
Using Visual Studio Code
Let's set a breakpoint and then start debugging using Visual Studio Code:
- Click in the statement that declares the variable named
a. - Navigate to Run | Toggle Breakpoint or press F9. A red circle will appear in the margin bar on the left-hand side to indicate that a breakpoint has been set, as shown in Figure 4.5:
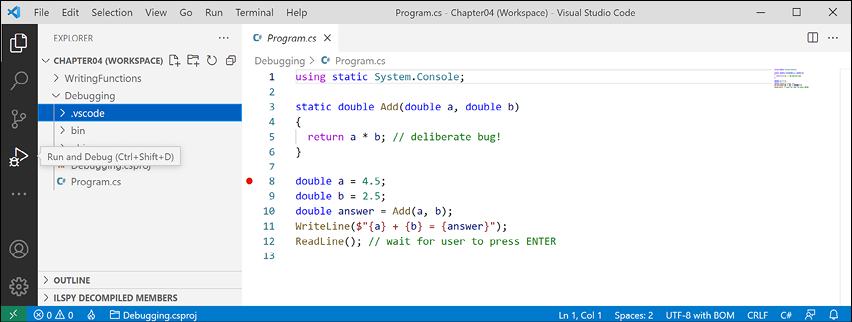
Figure 4.5: Toggling breakpoints using Visual Studio Code
Breakpoints can be toggled off with the same action. You can also left-click in the margin to toggle a breakpoint on and off, or right-click to see more options, such as remove, edit, or disable an existing breakpoint; or adding a breakpoint, conditional breakpoint, or logpoint when a breakpoint does not yet exist.
Logpoints, also known as tracepoints, indicate that you want to record some information without having to actually stop executing the code at that point.
- Navigate to View | Run, or in the left navigation bar you can click the Run and Debug icon (the triangle "play" button and "bug"), as shown in Figure 4.5.
- At the top of the DEBUG window, click on the dropdown to the right of the Start Debugging button (green triangular "play" button), and select .NET Core Launch (console) (Debugging), as shown in Figure 4.6:
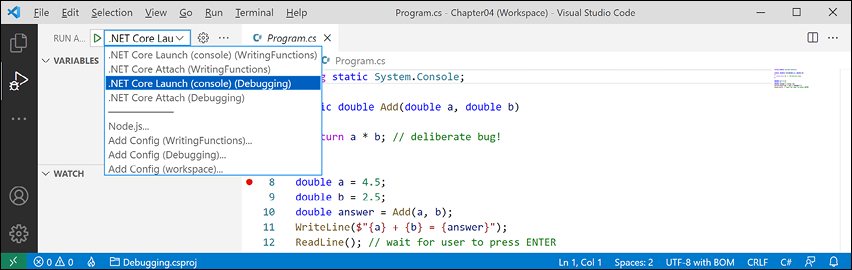
Figure 4.6: Selecting the project to debug using Visual Studio Code
Good Practice: If you do not see a choice in the dropdown list for the Debugging project, it is because that project does not have the assets needed to debug. Those assets are stored in the
.vscodefolder. To create the.vscodefolder for a project, navigate to View | Command Palette, select OmniSharp: Select Project, and then select the Debugging project. After a few seconds, when prompted, Required assets to build and debug are missing from 'Debugging'. Add them?, click Yes to add the missing assets. - At the top of the DEBUG window, click the Start Debugging button (green triangular "play" button), or navigate to Run | Start Debugging, or press F5. Visual Studio Code starts the console application and then pauses when it hits the breakpoint. This is known as break mode. The line that will be executed next is highlighted in yellow, and a yellow block points at the line from the margin bar, as shown in Figure 4.7:
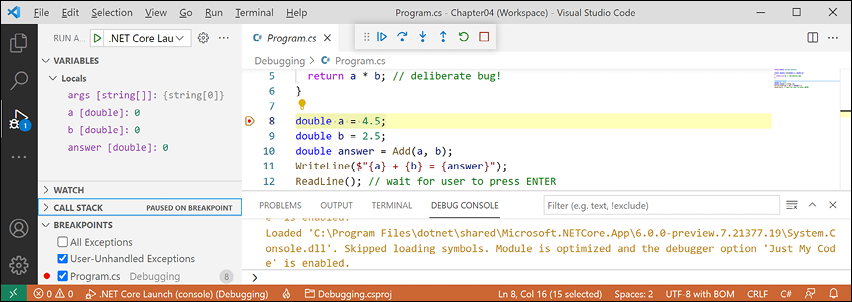
Figure 4.7: Break mode in Visual Studio Code
Navigating with the debugging toolbar
Visual Studio Code shows a floating toolbar with buttons to make it easy to access debugging features. Visual Studio 2022 has one button in its Standard toolbar to start or continue debugging and a separate Debugging toolbar for the rest of the tools.
Both are shown in Figure 4.8 and as described in the following list:
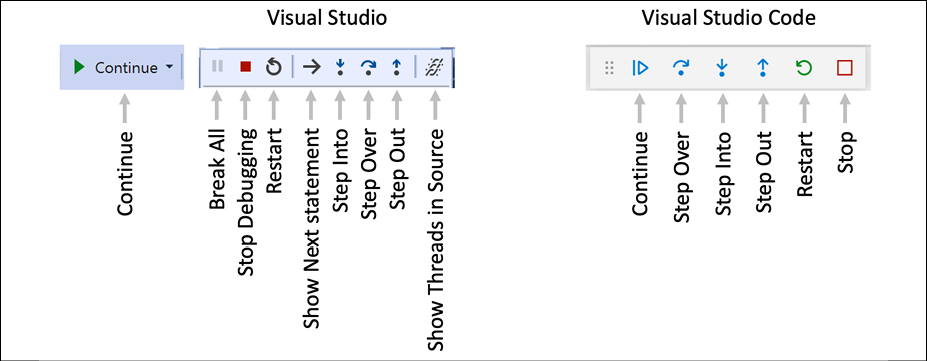
Figure 4.8: Debugging toolbars in Visual Studio 2022 and Visual Studio Code
- Continue/F5: This button will continue running the program from the current position until it ends or hits another breakpoint.
- Step Over/F10, Step Into/F11, and Step Out/Shift + F11 (blue arrows over dots): These buttons step through the code statements in various ways, as you will see in a moment.
- Restart/Ctrl or Cmd + Shift + F5 (circular arrow): This button will stop and then immediately restart the program with the debugger attached again.
- Stop/Shift + F5 (red square): This button will stop the debugging session.
Debugging windows
While debugging, both Visual Studio Code and Visual Studio show extra windows that allow you to monitor useful information, such as variables, while you step through your code.
The most useful windows are described in the following list:
- VARIABLES, including Locals, which shows the name, value, and type for any local variables automatically. Keep an eye on this window while you step through your code.
- WATCH, or Watch 1, which shows the value of variables and expressions that you manually enter.
- CALL STACK, which shows the stack of function calls.
- BREAKPOINTS, which shows all your breakpoints and allows finer control over them.
When in break mode, there is also a useful window at the bottom of the edit area:
- DEBUG CONSOLE or Immediate Window enables live interaction with your code. You can interrogate the program state, for example, by entering the name of a variable. For example, you can ask a question such as, "What is 1+2?" by typing
1+2and pressing Enter, as shown in Figure 4.9:
Figure 4.9: Interrogating the program state
Stepping through code
Let's explore some ways to step through the code using either Visual Studio or Visual Studio Code:
- Navigate to Run/Debug | Step Into, or click on the Step Into button in the toolbar, or press F11. The yellow highlight steps forward one line.
- Navigate to Run/Debug | Step Over, or click on the Step Over button in the toolbar, or press F10. The yellow highlight steps forward one line. At the moment, you can see that there is no difference between using Step Into or Step Over.
- You should now be on the line that calls the
Addmethod, as shown in Figure 4.10: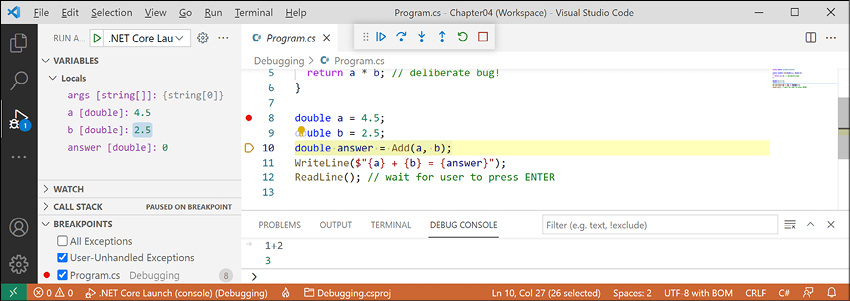
Figure 4.10: Stepping into and over code
The difference between Step Into and Step Over can be seen when you are about to execute a method call:
- If you click on Step Into, the debugger steps into the method so that you can step through every line in that method.
- If you click on Step Over, the whole method is executed in one go; it does not skip over the method without executing it.
- Click on Step Into to step inside the method.
- Hover your mouse pointer over the
aorbparameters in the code editing window and note that a tooltip appears showing their current value. - Select the expression
a * b, right-click the expression, and select Add to Watch or Add Watch. The expression is added to the WATCH window, showing that this operator is multiplyingabybto give the result11.25. - In the WATCH or Watch 1 window, right-click the expression and choose Remove Expression or Delete Watch.
- Fix the bug by changing
*to+in theAddfunction. - Stop debugging, recompile, and restart debugging by clicking the circular arrow Restart button or pressing Ctrl or Cmd + Shift + F5.
- Step over the function, take a minute to note how it now calculates correctly, and click the Continue button or press F5.
- With Visual Studio Code, note that when writing to the console during debugging, the output appears in the DEBUG CONSOLE window instead of the TERMINAL window, as shown in Figure 4.11:
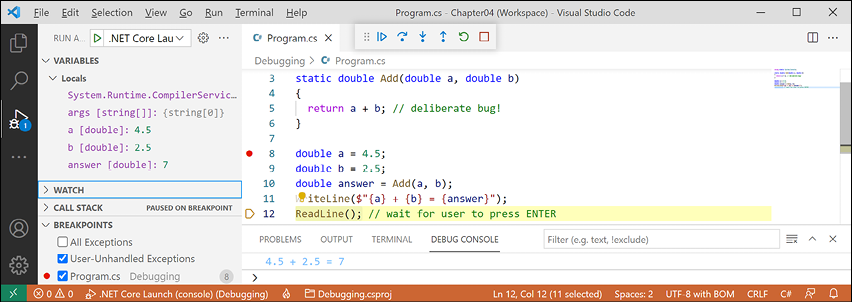
Figure 4.11: Writing to the DEBUG CONSOLE during debugging
Customizing breakpoints
It is easy to make more complex breakpoints:
- If you are still debugging, click the Stop button in the debugging toolbar, or navigate to Run/Debug | Stop Debugging, or press Shift + F5.
- Navigate to Run | Remove All Breakpoints or Debug | Delete All Breakpoints.
- Click on the
WriteLinestatement that outputs the answer. - Set a breakpoint by pressing F9 or navigating to Run/Debug | Toggle Breakpoint.
- In Visual Studio Code, right-click the breakpoint and choose Edit Breakpoint..., and then enter an expression, such as the
answervariable must be greater than 9, and note the expression must evaluate to true for the breakpoint to activate, as shown in Figure 4.12: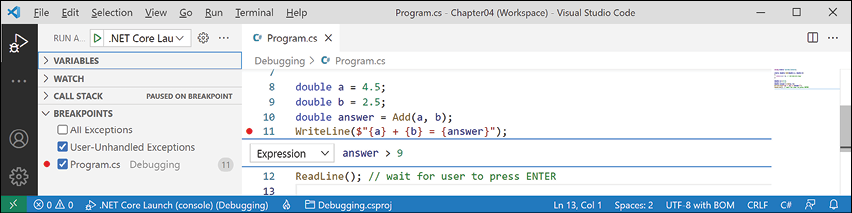
Figure 4.12: Customizing a breakpoint with an expression using Visual Studio Code
- In Visual Studio, right-click the breakpoint and choose Conditions..., and then enter an expression, such as the
answervariable must be greater than 9, and note the expression must evaluate to true for the breakpoint to activate. - Start debugging and note the breakpoint is not hit.
- Stop debugging.
- Edit the breakpoint or its conditions and change its expression to less than 9.
- Start debugging and note the breakpoint is hit.
- Stop debugging.
- Edit the breakpoint or its conditions, (in Visual Studio click Add condition) and select Hit Count, then enter a number such as
3, meaning that you would have to hit the breakpoint three times before it activates, as shown in Figure 4.13: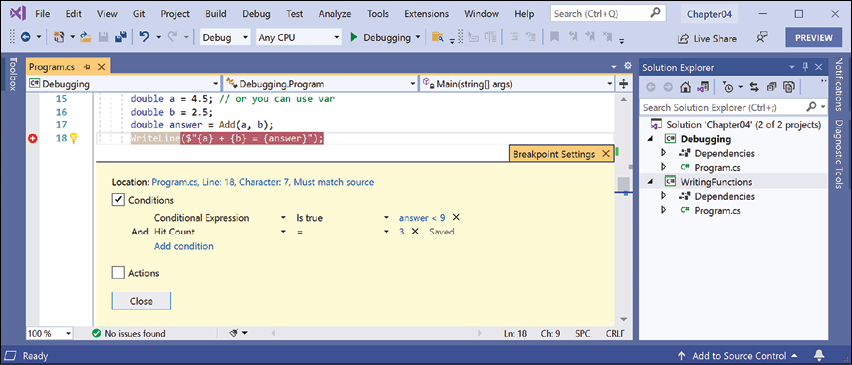
Figure 4.13: Customizing a breakpoint with an expression and hot count using Visual Studio 2022
- Hover your mouse over the breakpoint's red circle to see a summary, as shown in Figure 4.14:
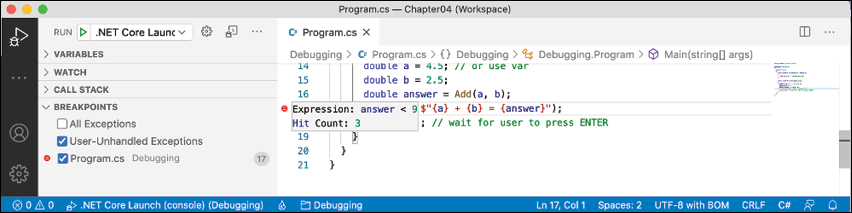
Figure 4.14: A summary of a customized breakpoint in Visual Studio Code
You have now fixed a bug using some debugging tools and seen some advanced possibilities for setting breakpoints.
Logging during development and runtime
Once you believe that all the bugs have been removed from your code, you would then compile a release version and deploy the application, so that people can use it. But no code is ever bug free, and during runtime unexpected errors can occur.
End users are notoriously bad at remembering, admitting to, and then accurately describing what they were doing when an error occurred, so you should not rely on them accurately providing useful information to reproduce the problem to understand what caused the problem and then fix it. Instead, you can instrument your code, which means logging events of interest.
Good Practice: Add code throughout your application to log what is happening, and especially when exceptions occur, so that you can review the logs and use them to trace the issue and fix the problem. Although we will see logging again in Chapter 10, Working with Data Using Entity Framework Core, and in Chapter 15, Building Websites Using the Model-View-Controller Pattern, logging is a huge topic, so we can only cover the basics in this book.
Understanding logging options
.NET includes some built-in ways to instrument your code by adding logging capabilities. We will cover the basics in this book. But logging is an area where third parties have created a rich ecosystem of powerful solutions that extend what Microsoft provides. I cannot make specific recommendations because the best logging framework depends on your needs. But I include some common ones in the following list:
- Apache log4net
- NLog
- Serilog
Instrumenting with Debug and Trace
There are two types that can be used to add simple logging to your code: Debug and Trace.
Before we delve into them in more detail, let's look at a quick overview of each one:
- The
Debugclass is used to add logging that gets written only during development. - The
Traceclass is used to add logging that gets written during both development and runtime.
You have seen the use of the Console type and its WriteLine method write out to the console window. There is also a pair of types named Debug and Trace that have more flexibility in where they write out to.
The Debug and Trace classes write to any trace listener. A trace listener is a type that can be configured to write output anywhere you like when the WriteLine method is called. There are several trace listeners provided by .NET, including one that outputs to the console, and you can even make your own by inheriting from the TraceListener type.
Writing to the default trace listener
One trace listener, the DefaultTraceListener class, is configured automatically and writes to Visual Studio Code's DEBUG CONSOLE window or Visual Studio's Debug window. You can configure other trace listeners using code.
Let's see trace listeners in action:
- Use your preferred coding tool to add a new Console Application to the
Chapter04workspace/solution namedInstrumenting. - In Visual Studio Code, select
Instrumentingas the active OmniSharp project. When you see the pop-up warning message saying that required assets are missing, click Yes to add them. - In
Program.cs, import theSystem.Diagnosticsnamespace. - Write a message from the
DebugandTraceclasses, as shown in the following code:Debug.WriteLine("Debug says, I am watching!"); Trace.WriteLine("Trace says, I am watching!"); - In Visual Studio, navigate to View | Output and make sure Show output from: Debug is selected.
- Start debugging the
Instrumentingconsole application, and note that DEBUG CONSOLE in Visual Studio Code or the Output window in Visual Studio 2022 shows the two messages, mixed with other debugging information, such as loaded assembly DLLs, as shown in Figures 4.15 and 4.16: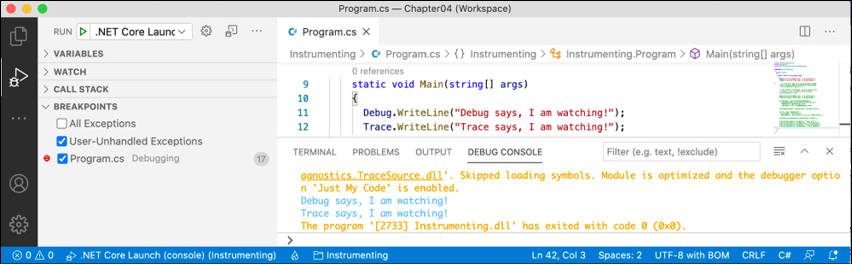
Figure 4.15: Visual Studio Code DEBUG CONSOLE shows the two messages in blue
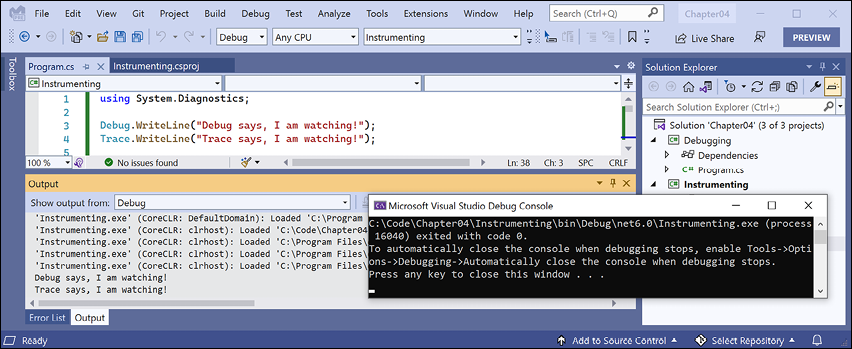
Figure 4.16: Visual Studio 2022 Output window shows Debug output including the two messages
Configuring trace listeners
Now, we will configure another trace listener that will write to a text file:
- Before the
DebugandTracecalls toWriteLine, add a statement to create a new text file on the desktop and pass it into a new trace listener that knows how to write to a text file, and enable automatic flushing for its buffer, as shown highlighted in the following code:// write to a text file in the project folder Trace.Listeners.Add(new TextWriterTraceListener( File.CreateText(Path.Combine(Environment.GetFolderPath( Environment.SpecialFolder.DesktopDirectory), "log.txt")))); // text writer is buffered, so this option calls // Flush() on all listeners after writing Trace.AutoFlush = true; Debug.WriteLine("Debug says, I am watching!"); Trace.WriteLine("Trace says, I am watching!");Good Practice: Any type that represents a file usually implements a buffer to improve performance. Instead of writing immediately to the file, data is written to an in-memory buffer and only once the buffer is full will it be written in one chunk to the file. This behavior can be confusing while debugging because we do not immediately see the results! Enabling
AutoFlushmeans it calls theFlushmethod automatically after every write. - In Visual Studio Code, run the release configuration of the console app by entering the following command in the TERMINAL window for the
Instrumentingproject and note that nothing will appear to have happened:dotnet run --configuration Release - In Visual Studio 2022, in the standard toolbar, select Release in the Solution Configurations dropdown list, as shown in Figure 4.17:

Figure 4.17: Selecting the Release configuration in Visual Studio
- In Visual Studio 2022, run the release configuration of the console app by navigating to Debug | Start Without Debugging.
- On your desktop, open the file named
log.txtand note that it contains the messageTrace says, I am watching!. - In Visual Studio Code, run the debug configuration of the console app by entering the following command in the TERMINAL window for the
Instrumentingproject:dotnet run --configuration Debug - In Visual Studio, in the standard toolbar, select Debug in the Solution Configurations dropdown list and then run the console app by navigating to Debug | Start Debugging.
- On your desktop, open the file named
log.txtand note that it contains both the message,Debug says, I am watching!andTrace says, I am watching!.
Good Practice: When running with the Debug configuration, both Debug and Trace are active and will write to any trace listeners. When running with the Release configuration, only Trace will write to any trace listeners. You can therefore use Debug.WriteLine calls liberally throughout your code, knowing they will be stripped out automatically when you build the release version of your application and will therefore not affect performance.
Switching trace levels
The Trace.WriteLine calls are left in your code even after release. So, it would be great to have fine control over when they are output. This is something we can do with a trace switch.
The value of a trace switch can be set using a number or a word. For example, the number 3 can be replaced with the word Info, as shown in the following table:
|
Number |
Word |
Description |
|
0 |
Off |
This will output nothing. |
|
1 |
Error |
This will output only errors. |
|
2 |
Warning |
This will output errors and warnings. |
|
3 |
Info |
This will output errors, warnings, and information. |
|
4 |
Verbose |
This will output all levels. |
Let's explore using trace switches. First, we will add some NuGet packages to our project to enable loading configuration settings from a JSON appsettings file.
Adding packages to a project in Visual Studio Code
Visual Studio Code does not have a mechanism to add NuGet packages to a project, so we will use the command-line tool:
- Navigate to the TERMINAL window for the
Instrumentingproject. - Enter the following command:
dotnet add package Microsoft.Extensions.Configuration - Enter the following command:
dotnet add package Microsoft.Extensions.Configuration.Binder - Enter the following command:
dotnet add package Microsoft.Extensions.Configuration.Json - Enter the following command:
dotnet add package Microsoft.Extensions.Configuration.FileExtensionsdotnet add packageadds a reference to a NuGet package to your project file. It will be downloaded during the build process.dotnet add referenceadds a project-to-project reference to your project file. The referenced project will be compiled if needed during the build process.
Adding packages to a project in Visual Studio 2022
Visual Studio has a graphical user interface for adding packages.
- In Solution Explorer, right-click the Instrumenting project and select Manage NuGet Packages.
- Select the Browse tab.
- In the search box, enter
Microsoft.Extensions.Configuration. - Select each of these NuGet packages and click the Install button, as shown in Figure 4.18:
Microsoft.Extensions.ConfigurationMicrosoft.Extensions.Configuration.BinderMicrosoft.Extensions.Configuration.JsonMicrosoft.Extensions.Configuration.FileExtensions
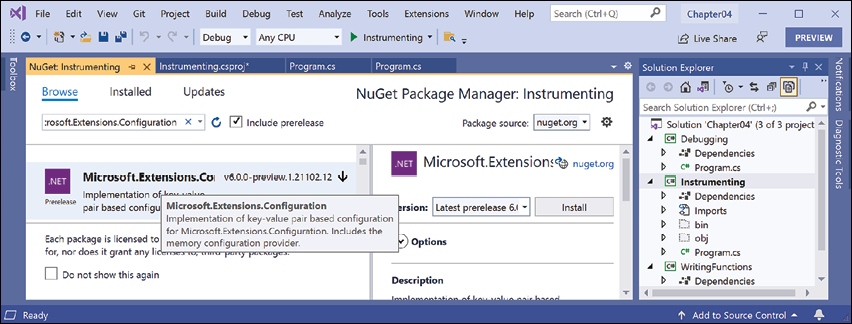
Figure 4.18: Installing NuGet packages using Visual Studio 2022
Good Practice: There are also packages for loading configuration from XML files, INI files, environment variables, and the command line. Use the most appropriate technique for setting configuration in your projects.
Reviewing project packages
After adding the NuGet packages, we can see the references in the project file:
- Open
Instrumenting.csproj(double-click the Instrumenting project in Visual Studio's Solution Explorer) and note the<ItemGroup>section with the added NuGet packages, as shown highlighted in the following markup:<Project Sdk="Microsoft.NET.Sdk"> <PropertyGroup> <OutputType>Exe</OutputType> <TargetFramework>net6.0</TargetFramework> <Nullable>enable</Nullable> <ImplicitUsings>enable</ImplicitUsings> </PropertyGroup> <ItemGroup> <PackageReference Include="Microsoft.Extensions.Configuration" Version="6.0.0" /> <PackageReference Include="Microsoft.Extensions.Configuration.Binder" Version="6.0.0" /> <PackageReference Include="Microsoft.Extensions.Configuration.FileExtensions" Version="6.0.0" /> <PackageReference Include="Microsoft.Extensions.Configuration.Json" Version="6.0.0" /> </ItemGroup> </Project> - Add a file named
appsettings.jsonto theInstrumentingproject folder. - Modify
appsettings.jsonto define a setting namedPacktSwitchwith aLevelvalue, as shown in the following code:{ "PacktSwitch": { "Level": "Info" } } - In Visual Studio 2022, in Solution Explorer, right-click
appsettings.json, select Properties, and then in the Properties window, change Copy to Output Directory to Copy if newer. This is necessary because unlike Visual Studio Code, which runs the console app in the project folder, Visual Studio runs the console app inInstrumenting\bin\Debug\net6.0orInstrumenting\bin\Release\net6.0. - At the top of
Program.cs, import theMicrosoft.Extensions.Configurationnamespace. - Add some statements to the end of
Program.csto create a configuration builder that looks in the current folder for a file namedappsettings.json, build the configuration, create a trace switch, set its level by binding to the configuration, and then output the four trace switch levels, as shown in the following code:ConfigurationBuilder builder = new(); builder.SetBasePath(Directory.GetCurrentDirectory()) .AddJsonFile("appsettings.json", optional: true, reloadOnChange: true); IConfigurationRoot configuration = builder.Build(); TraceSwitch ts = new( displayName: "PacktSwitch", description: "This switch is set via a JSON config."); configuration.GetSection("PacktSwitch").Bind(ts); Trace.WriteLineIf(ts.TraceError, "Trace error"); Trace.WriteLineIf(ts.TraceWarning, "Trace warning"); Trace.WriteLineIf(ts.TraceInfo, "Trace information"); Trace.WriteLineIf(ts.TraceVerbose, "Trace verbose"); - Set a breakpoint on the
Bindstatement. - Start debugging the
Instrumentingconsole app.In the VARIABLES or Locals window, expand thetsvariable expression, and note that itsLevelisOffand itsTraceError,TraceWarning, and so on are allfalse, as shown in Figure 4.19: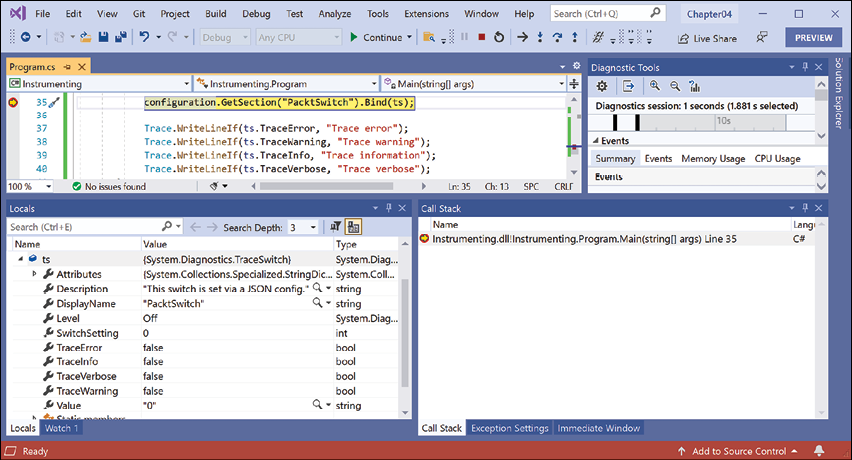
Figure 4.19: Watching the trace switch variable properties in Visual Studio 2022
- Step into the call to the
Bindmethod by clicking the Step Into or Step Over buttons or pressing F11 or F10, and note thetsvariable watch expression updates to theInfolevel. - Step into or over the four calls to
Trace.WriteLineIfand note that all levels up toInfoare written to the DEBUG CONSOLE or Output - Debug window, but notVerbose, as shown in Figure 4.20: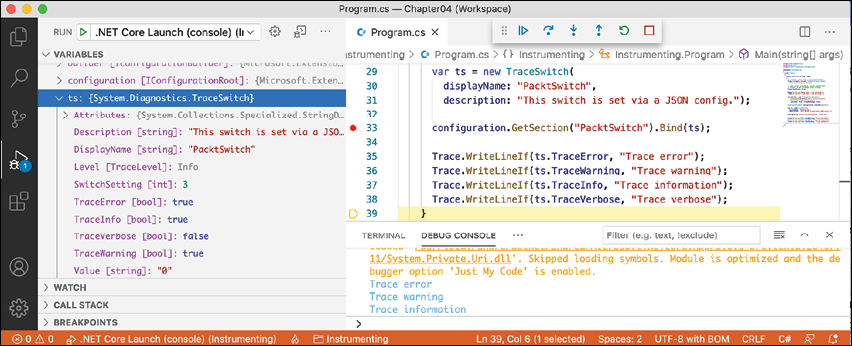
Figure 4.20: Different trace levels shown in the DEBUG CONSOLE in Visual Studio Code
- Stop debugging.
- Modify
appsettings.jsonto set a level of2, which means warning, as shown in the following JSON file:{ "PacktSwitch": { "Level": "2" } } - Save the changes.
- In Visual Studio Code, run the console application by entering the following command in the TERMINAL window for the
Instrumentingproject:dotnet run --configuration Release - In Visual Studio, in the standard toolbar, select Release in the Solution Configurations dropdown list and then run the console app by navigating to Debug | Start Without Debugging.
- Open the file named
log.txtand note that this time, only trace error and warning levels are the output of the four potential trace levels, as shown in the following text file:Trace says, I am watching! Trace error Trace warning
If no argument is passed, the default trace switch level is Off (0), so none of the switch levels are output.
Unit testing
Fixing bugs in code is expensive. The earlier that a bug is discovered in the development process, the less expensive it will be to fix.
Unit testing is a good way to find bugs early in the development process. Some developers even follow the principle that programmers should create unit tests before they write code, and this is called Test-Driven Development (TDD).
Microsoft has a proprietary unit testing framework known as MS Test. There is also a framework named NUnit. However, we will use the free and open-source third-party framework xUnit.net. xUnit was created by the same team that built NUnit but they fixed the mistakes they felt they made previously. xUnit is more extensible and has better community support.
Understanding types of testing
Unit testing is just one of many types of testing, as described in the following table:
|
Type of testing |
Description |
|
Unit |
Tests the smallest unit of code, typically a method or function. Unit testing is performed on a unit of code isolated from its dependencies by mocking them if needed. Each unit should have multiple tests: some with typical inputs and expected outputs, some with extreme input values to test boundaries, and some with deliberately wrong inputs to test exception handling. |
|
Integration |
Tests if the smaller units and larger components work together as a single piece of software. Sometimes involves integrating with external components that you do not have source code for. |
|
System |
Tests the whole system environment in which your software will run. |
|
Performance |
Tests the performance of your software; for example, your code must return a web page full of data to a visitor in under 20 milliseconds. |
|
Load |
Tests how many requests your software can handle simultaneously while maintaining required performance, for example, 10,000 concurrent visitors to a website. |
|
User Acceptance |
Tests if users can happily complete their work using your software. |
Creating a class library that needs testing
First, we will create a function that needs testing. We will create it in a class library project. A class library is a package of code that can be distributed and referenced by other .NET applications:
- Use your preferred coding tool to add a new Class Library to the
Chapter04workspace/solution namedCalculatorLib. Thedotnet newtemplate is namedclasslib. - Rename the file named
Class1.cstoCalculator.cs. - Modify the file to define a
Calculatorclass (with a deliberate bug!), as shown in the following code:namespace Packt { public class Calculator { public double Add(double a, double b) { return a * b; } } } - Compile your class library project:
- In Visual Studio 2022, navigate to Build | Build CalculatorLib.
- In Visual Studio Code, in TERMINAL, enter the command
dotnet build.
- Use your preferred coding tool to add a new xUnit Test Project [C#] to the
Chapter04workspace/solution namedCalculatorLibUnitTests. Thedotnet newtemplate is namedxunit. - If you are using Visual Studio, in Solution Explorer, select the
CalculatorLibUnitTestsproject, navigate to Project | Add Project Reference…, check the box to select theCalculatorLibproject, and then click OK. - If you are using Visual Studio Code, use the
dotnet add referencecommand or click on the file namedCalculatorLibUnitTests.csproj, and modify the configuration to add an item group with a project reference to theCalculatorLibproject, as shown highlighted in the following markup:<Project Sdk="Microsoft.NET.Sdk"> <PropertyGroup> <TargetFramework>net6.0</TargetFramework> <Nullable>enable</Nullable> <IsPackable>false</IsPackable> </PropertyGroup> <ItemGroup> <PackageReference Include="Microsoft.NET.Test.Sdk" Version="16.10.0" /> <PackageReference Include="xunit" Version="2.4.1" /> <PackageReference Include="xunit.runner.visualstudio" Version="2.4.3"> <IncludeAssets>runtime; build; native; contentfiles; analyzers; buildtransitive</IncludeAssets> <PrivateAssets>all</PrivateAssets> </PackageReference> <PackageReference Include="coverlet.collector" Version="3.0.2"> <IncludeAssets>runtime; build; native; contentfiles; analyzers; buildtransitive</IncludeAssets> <PrivateAssets>all</PrivateAssets> </PackageReference> </ItemGroup> <ItemGroup> <ProjectReference Include="..\CalculatorLib\CalculatorLib.csproj" /> </ItemGroup> </Project> - Build the
CalculatorLibUnitTestsproject.
Writing unit tests
A well-written unit test will have three parts:
- Arrange: This part will declare and instantiate variables for input and output.
- Act: This part will execute the unit that you are testing. In our case, that means calling the method that we want to test.
- Assert: This part will make one or more assertions about the output. An assertion is a belief that, if not true, indicates a failed test. For example, when adding 2 and 2, we would expect the result to be 4.
Now, we will write some unit tests for the Calculator class:
- Rename the file
UnitTest1.cstoCalculatorUnitTests.csand then open it. - In Visual Studio Code, rename the class to
CalculatorUnitTests. (Visual Studio prompts you to rename the class when you rename the file.) - Import the
Packtnamespace. - Modify the
CalculatorUnitTestsclass to have two test methods for adding 2 and 2, and adding 2 and 3, as shown in the following code:using Packt; using Xunit; namespace CalculatorLibUnitTests { public class CalculatorUnitTests { [Fact] public void TestAdding2And2() { // arrange double a = 2; double b = 2; double expected = 4; Calculator calc = new(); // act double actual = calc.Add(a, b); // assert Assert.Equal(expected, actual); } [Fact] public void TestAdding2And3() { // arrange double a = 2; double b = 3; double expected = 5; Calculator calc = new(); // act double actual = calc.Add(a, b); // assert Assert.Equal(expected, actual); } } }
Running unit tests using Visual Studio Code
Now we are ready to run the unit tests and see the results:
- In the
CalculatorLibUnitTestproject's TERMINAL window, run the tests, as shown in the following command:dotnet test - Note that the results indicate that two tests ran, one test passed, and one test failed, as shown in Figure 4.21:
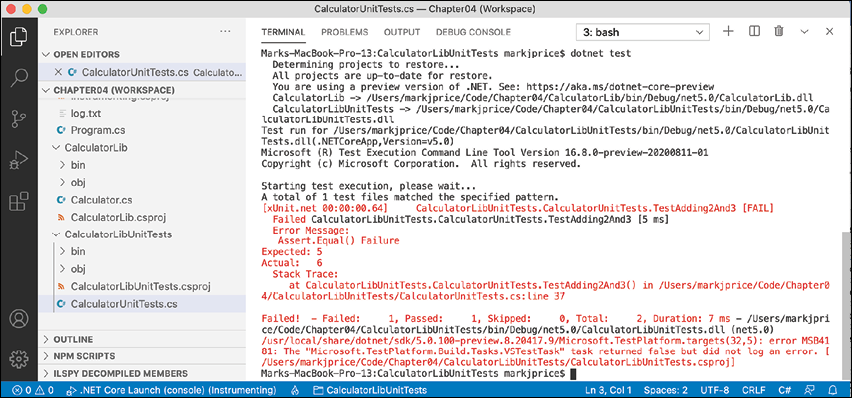
Figure 4.21: The unit test results in Visual Studio Code's TERMINAL
Running unit tests using Visual Studio
Now we are ready to run the unit tests and see the results:
- Navigate to Test | Run All Tests.
- In Test Explorer, note that the results indicate that two tests ran, one test passed, and one test failed, as shown in Figure 4.22:
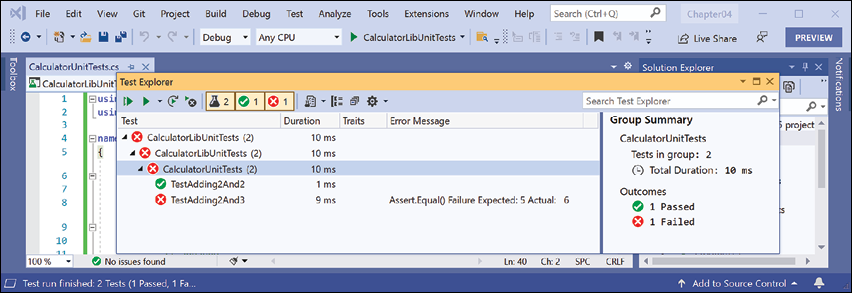
Figure 4.22: The unit test results in Visual Studio 2022's Test Explorer
Fix the bug
Now you can fix the bug:
- Fix the bug in the
Addmethod. - Run the unit tests again to see that the bug has now been fixed and both tests pass.
Throwing and catching exceptions in functions
In Chapter 3, Controlling Flow, Converting Types, and Handling Exceptions, you were introduced to exceptions and how to use a try-catch statement to handle them. But you should only catch and handle an exception if you have enough information to mitigate the issue. If you do not, then you should allow the exception to pass up through the call stack to a higher level.
Understanding usage errors and execution errors
Usage errors are when a programmer misuses a function, typically by passing invalid values as parameters. They could be avoided by that programmer changing their code to pass valid values. When some programmers first learn C# and .NET, they sometimes think exceptions can always be avoided because they assume all errors are usage errors. Usage errors should all be fixed before production runtime.
Execution errors are when something happens at runtime that cannot be fixed by writing "better" code. Execution errors can be split into program errors and system errors. If you attempt to access a network resource but the network is down, you need to be able to handle that system error by logging an exception, and possibly backing off for a time and trying again. But some system errors, such as running out of memory, simply cannot be handled. If you attempt to open a file that does not exist, you might be able to catch that error and handle it programmatically by creating a new file. Program errors can be programmatically fixed by writing smart code. System errors often cannot be fixed programmatically.
Commonly thrown exceptions in functions
Very rarely should you define new types of exceptions to indicate usage errors. .NET already defines many that you should use.
When defining your own functions with parameters, your code should check the parameter values and throw exceptions if they have values that will prevent your function from properly functioning.
For example, if a parameter should not be null, throw ArgumentNullException. For other problems, throw ArgumentException, NotSupportedException, or InvalidOperationException. For any exception, include a message that describes the problem for whoever will have to read it (typically a developer audience for class libraries and functions, or end users if it is at the highest level of a GUI app), as shown in the following code:
static void Withdraw(string accountName, decimal amount)
{
  if (accountName is null)
  {
    throw new ArgumentNullException(paramName: nameof(accountName));
  }
  if (amount < 0)
  {
    throw new ArgumentException(
      message: $"{nameof(amount)} cannot be less than zero.");
  }
  // process parameters
}
Good Practice: If a function cannot successfully perform its operation, you should consider that a function failure and report it by throwing an exception.
You should never need to write a try-catch statement to catch these usage type errors. You want the application to terminate. These exceptions should cause the programmer who is calling the function to fix their code to prevent the problem. They should be fixed before production deployment. That does not mean that your code does not need to throw usage error type exceptions. You should—to force other programmers to call your functions correctly!
Understanding the call stack
The entry point for a .NET console application is the Main method of the Program class, regardless of if you have explicitly defined this class and method or if it was created for you by the top-level program feature.
The Main method will call other methods, that call other methods, and so on, and these methods could be in the current project or in referenced projects and NuGet packages, as shown in Figure 4.23:
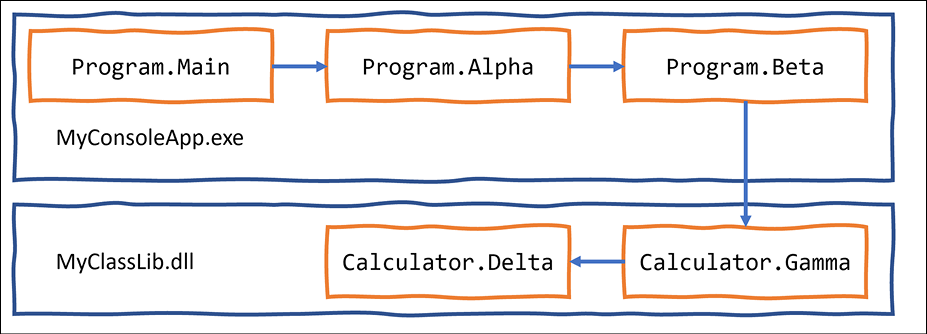
Figure 4.23: A chain of method calls that create a call stack
Let's create a similar chain of methods to explore where we could catch and handle exceptions:
- Use your preferred coding tool to add a new Class Library to the
Chapter04workspace/solution namedCallStackExceptionHandlingLib. - Rename the
Class1.csfile toCalculator.cs. - Open
Calculator.csand modify its contents, as shown in the following code:using static System.Console; namespace Packt; public class Calculator { public static void Gamma() // public so it can be called from outside { WriteLine("In Gamma"); Delta(); } private static void Delta() // private so it can only be called internally { WriteLine("In Delta"); File.OpenText("bad file path"); } } - Use your preferred coding tool to add a new Console Application to the
Chapter04workspace/solution namedCallStackExceptionHandling. - In Visual Studio Code, select
CallStackExceptionHandlingas the active OmniSharp project. When you see the pop-up warning message saying that required assets are missing, click Yes to add them. - In the
CallStackExceptionHandlingproject, add a reference to theCallStackExceptionHandlingLibproject. - In
Program.cs, add statements to define two methods and chain calls to them, and the methods in the class library, as shown in the following code:using Packt; using static System.Console; WriteLine("In Main"); Alpha(); static void Alpha() { WriteLine("In Alpha"); Beta(); } static void Beta() { WriteLine("In Beta"); Calculator.Gamma(); } - Run the console app, and note the results, as shown in the following partial output:
In Main
In Alpha
In Beta
In Gamma
In Delta
Unhandled exception. System.IO.FileNotFoundException: Could not find file 'C:\Code\Chapter04\CallStackExceptionHandling\bin\Debug\net6.0\bad file path'.
   at Microsoft.Win32.SafeHandles.SafeFileHandle.CreateFile(...
   at Microsoft.Win32.SafeHandles.SafeFileHandle.Open(...
   at System.IO.Strategies.OSFileStreamStrategy..ctor(...
   at System.IO.Strategies.FileStreamHelpers.ChooseStrategyCore(...
   at System.IO.Strategies.FileStreamHelpers.ChooseStrategy(...
   at System.IO.StreamReader.ValidateArgsAndOpenPath(...
   at System.IO.File.OpenText(String path) in ...
   at Packt.Calculator.Delta() in C:\Code\Chapter04\CallStackExceptionHandlingLib\Calculator.cs:line 16
   at Packt.Calculator.Gamma() in C:\Code\Chapter04\CallStackExceptionHandlingLib\Calculator.cs:line 10
   at <Program>$.<<Main>$>g__Beta|0_1() in C:\Code\Chapter04\CallStackExceptionHandling\Program.cs:line 16
   at <Program>$.<<Main>$>g__Alpha|0_0() in C:\Code\Chapter04\CallStackExceptionHandling\Program.cs:line 10
   at <Program>$.<Main>$(String[] args) in C:\Code\Chapter04\CallStackExceptionHandling\Program.cs:line 5
Note the following:
- The call stack is upside-down. Starting from the bottom, you see:
- The first call is to the
Mainentry point function in the auto-generatedProgramclass. This is where arguments are passed in as astringarray. - The second call is to the
Alphafunction. - The third call is to the
Betafunction. - The fourth call is to the
Gammafunction. - The fifth call is to the
Deltafunction. This function attempts to open a file by passing a bad file path. This causes an exception to be thrown. Any function with atry-catchstatement could catch this exception. If they do not, it is automatically passed up the call stack until it reaches the top, where .NET outputs the exception (and the details of this call stack).
- The first call is to the
Where to catch exceptions
Programmers can decide if they want to catch an exception near the failure point, or centralized higher up the call stack. This allows your code to be simplified and standardized. You might know that calling an exception could throw one or more types of exception, but you do not need to handle any of them at the current point in the call stack.
Rethrowing exceptions
Sometimes you want to catch an exception, log it, and then rethrow it. There are three ways to rethrow an exception inside a catch block, as shown in the following list:
- To throw the caught exception with its original call stack, call
throw. - To throw the caught exception as if it was thrown at the current level in the call stack, call
throwwith the caught exception, for example,throw ex. This is usually poor practice because you have lost some potentially useful information for debugging. - To wrap the caught exception in another exception that can include more information in a message that might help the caller understand the problem, throw a new exception and pass the caught exception as the
innerExceptionparameter.
If an error could occur when we call the Gamma function then we could catch the exception and then perform one of the three techniques of rethrowing an exception, as shown in the following code:
try
{
  Gamma();
}
catch (IOException ex)
{
  LogException(ex);
  // throw the caught exception as if it happened here
  // this will lose the original call stack
  throw ex;
  // rethrow the caught exception and retain its original call stack
  throw;
  // throw a new exception with the caught exception nested within it
  throw new InvalidOperationException(
    message: "Calculation had invalid values. See inner exception for why.",
    innerException: ex);
}
Let's see this in action with our call stack example:
- In the
CallStackExceptionHandlingproject, inProgram.cs, in theBetafunction, add atry-catchstatement around the call to theGammafunction, as shown highlighted in the following code:static void Beta() { WriteLine("In Beta"); try { Calculator.Gamma(); } catch (Exception ex) { WriteLine($"Caught this: {ex.Message}"); throw ex; } } - Note the green squiggle under the
exto warn you that you will lose call stack information. - Run the console app and note the output excludes some details of the call stack, as shown in the following output:
Caught this: Could not find file 'C:\Code\Chapter04\CallStackExceptionHandling\bin\Debug\net6.0\bad file path'. Unhandled exception. System.IO.FileNotFoundException: Could not find file 'C:\Code\Chapter04\CallStackExceptionHandling\bin\Debug\net6.0\bad file path'. File name: 'C:\Code\Chapter04\CallStackExceptionHandling\bin\Debug\net6.0\bad file path' at <Program>$.<<Main>$>g__Beta|0_1() in C:\Code\Chapter04\CallStackExceptionHandling\Program.cs:line 25 at <Program>$.<<Main>$>g__Alpha|0_0() in C:\Code\Chapter04\CallStackExceptionHandling\Program.cs:line 11 at <Program>$.<Main>$(String[] args) in C:\Code\Chapter04\CallStackExceptionHandling\Program.cs:line 6 - Delete the
exwhen rethrowing. - Run the console app and note the output includes all the details of the call stack.
Implementing the tester-doer pattern
The tester-doer pattern can avoid some thrown exceptions (but not eliminate them completely). This pattern uses pairs of functions: one to perform a test, the other to perform an action that would fail if the test is not passed.
.NET implements this pattern itself. For example, before adding an item to a collection by calling the Add method, you can test to see if it is read-only, which would cause Add to fail and therefore throw an exception.
For example, before withdrawing money from a bank account, you might test that the account is not overdrawn, as shown in the following code:
if (!bankAccount.IsOverdrawn())
{
  bankAccount.Withdraw(amount);
}
Problems with the tester-doer pattern
The tester-doer pattern can add performance overhead, so you can also implement the try pattern, which in effect combines the test and do parts into a single function, as we saw with TryParse.
Another problem with the tester-doer pattern occurs when you are using multiple threads. In this scenario, one thread could call the test function and it returns okay. But then another thread executes that changes the state. Then the original thread continues executing assuming everything is fine, but it is not fine. This is called a race condition. We will see how we could handle it in Chapter 12, Improving Performance and Scalability Using Multitasking.
If you implement your own try pattern function and it fails, remember to set the out parameter to the default value of its type and then return false, as shown in the following code:
static bool TryParse(string? input, out Person value)
{
  if (someFailure)
  {
    value = default(Person);
    return false;
  }
  // successfully parsed the string into a Person
  value = new Person() { ... };
  return true;
}
Practicing and exploring
Test your knowledge and understanding by answering some questions, get some hands-on practice, and explore with deeper research into the topics covered in this chapter.
Exercise 4.1 – Test your knowledge
Answer the following questions. If you get stuck, try Googling the answers if necessary, while remembering that if you get totally stuck, the answers are in the Appendix:
- What does the C# keyword
voidmean? - What are some differences between imperative and functional programming styles?
- In Visual Studio Code or Visual Studio, what is the difference between pressing F5, Ctrl or Cmd + F5, Shift + F5, and Ctrl or Cmd + Shift + F5?
- Where does the
Trace.WriteLinemethod write its output to? - What are the five trace levels?
- What is the difference between the
DebugandTraceclasses? - When writing a unit test, what are the three "A"s?
- When writing a unit test using xUnit, what attribute must you decorate the test methods with?
- What
dotnetcommand executes xUnit tests? - What statement should you use to rethrow a caught exception named
exwithout losing the stack trace?
Exercise 4.2 – Practice writing functions with debugging and unit testing
Prime factors are the combination of the smallest prime numbers that, when multiplied together, will produce the original number. Consider the following example:
- Prime factors of 4 are: 2 x 2
- Prime factors of 7 are: 7
- Prime factors of 30 are: 5 x 3 x 2
- Prime factors of 40 are: 5 x 2 x 2 x 2
- Prime factors of 50 are: 5 x 5 x 2
Create a workspace/solution named PrimeFactors to contain three projects: a class library with a method named PrimeFactors that, when passed an int variable as a parameter, returns a string showing its prime factors; a unit tests project; and a console application to use it.
To keep it simple, you can assume that the largest number entered will be 1,000.
Use the debugging tools and write unit tests to ensure that your function works correctly with multiple inputs and returns the correct output.
Exercise 4.3 – Explore topics
Use the links on the following page to learn more detail about the topics covered in this chapter:
Summary
In this chapter, you learned how to write reusable functions with input parameters and return values, in both an imperative and functional style, and then how to use the Visual Studio and Visual Studio Code debugging and diagnostic features to fix any bugs in them. Finally, you learned how to throw and catch exceptions in functions and understand the call stack.
In the next chapter, you will learn how to build your own types using object-oriented programming techniques.